Daily Log
Losses, notes
From chick placement to catching: losses, weigh-ins, feed deliveries, house environment, vaccination, medication, costs and harvest timing — all in one place. Benchmarked against the breeder's official performance objectives, right down to net profit per bird.
A notebook, a whiteboard, a messaging thread, and your own head. By the time you sit down to work out what the flock made, the pieces no longer fit back together.
Eight birds down today — is that high or normal? Average weight 2,050 g — is the flock growing well? Without something to compare against, there is nothing to judge.
The day-11 booster, the withdrawal period on a treatment, the weigh-in you still have not done this week — in a busy week something always slips.
Feed and chicks are simple enough. Employer insurance contributions, the house write-down, the empty days between flocks — those usually never make it into the sum.
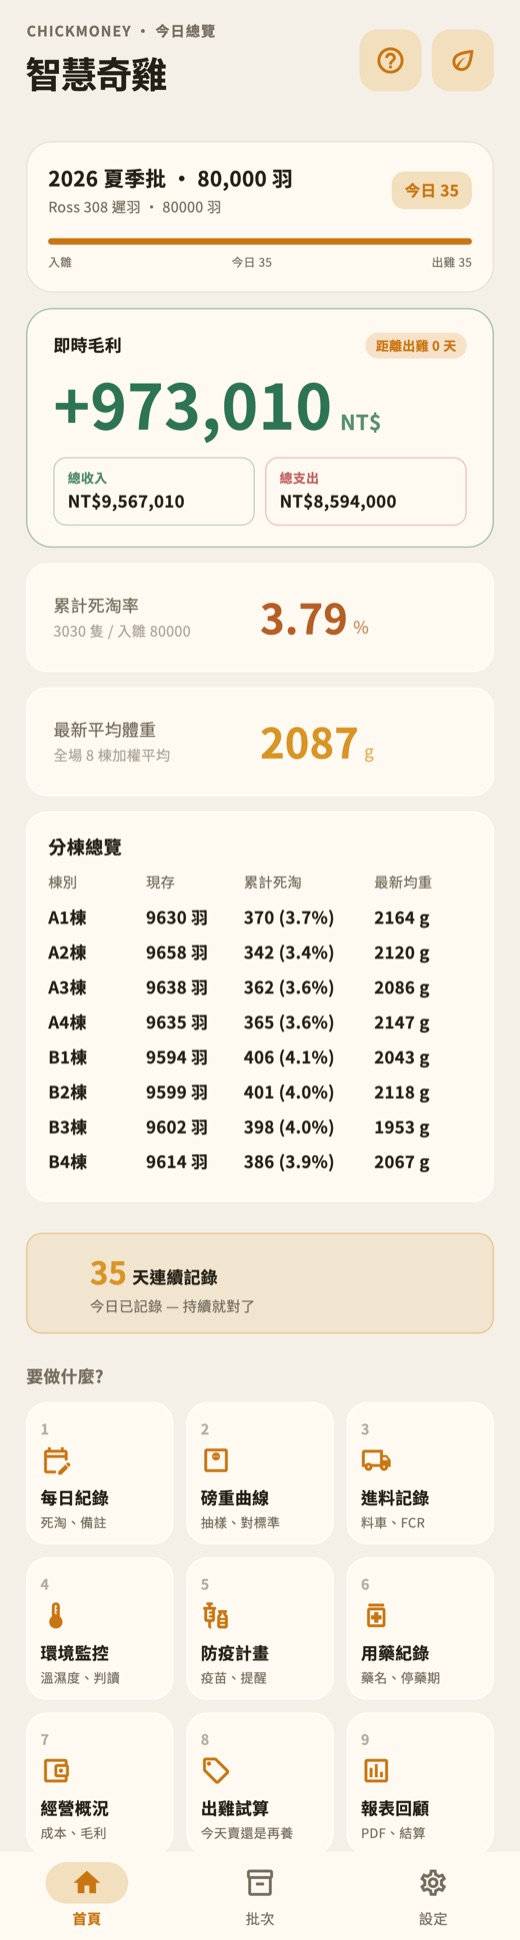
Only three tabs along the bottom; every feature sits in the nine tiles. Nothing to learn — look once and you have it.
These four are where ChickMoney genuinely differs from an ordinary bookkeeping app.
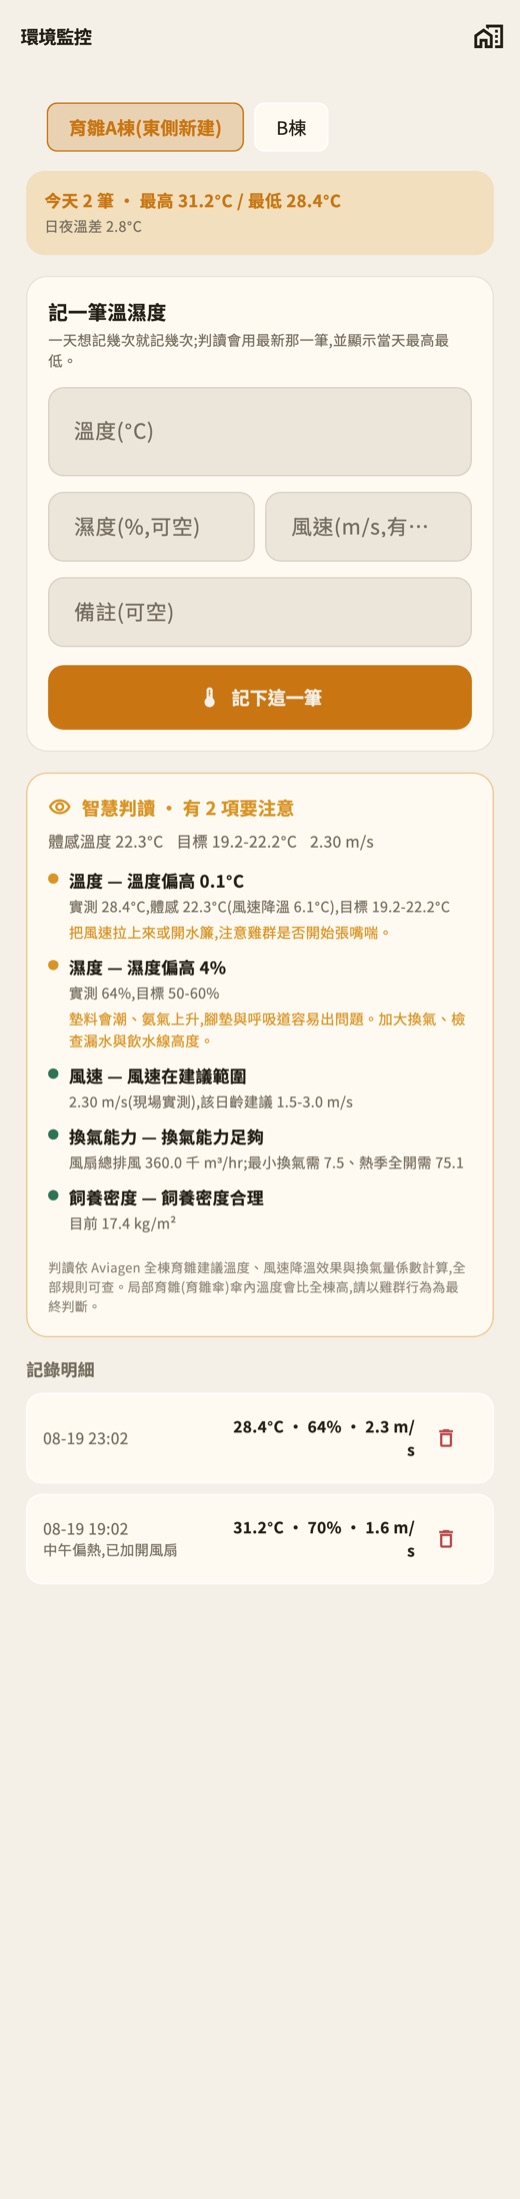
Enter the house once — length, width, height, whether it has a ceiling, how many fans and what size. After that, walk the house and log the temperature; everything else is worked out for you.
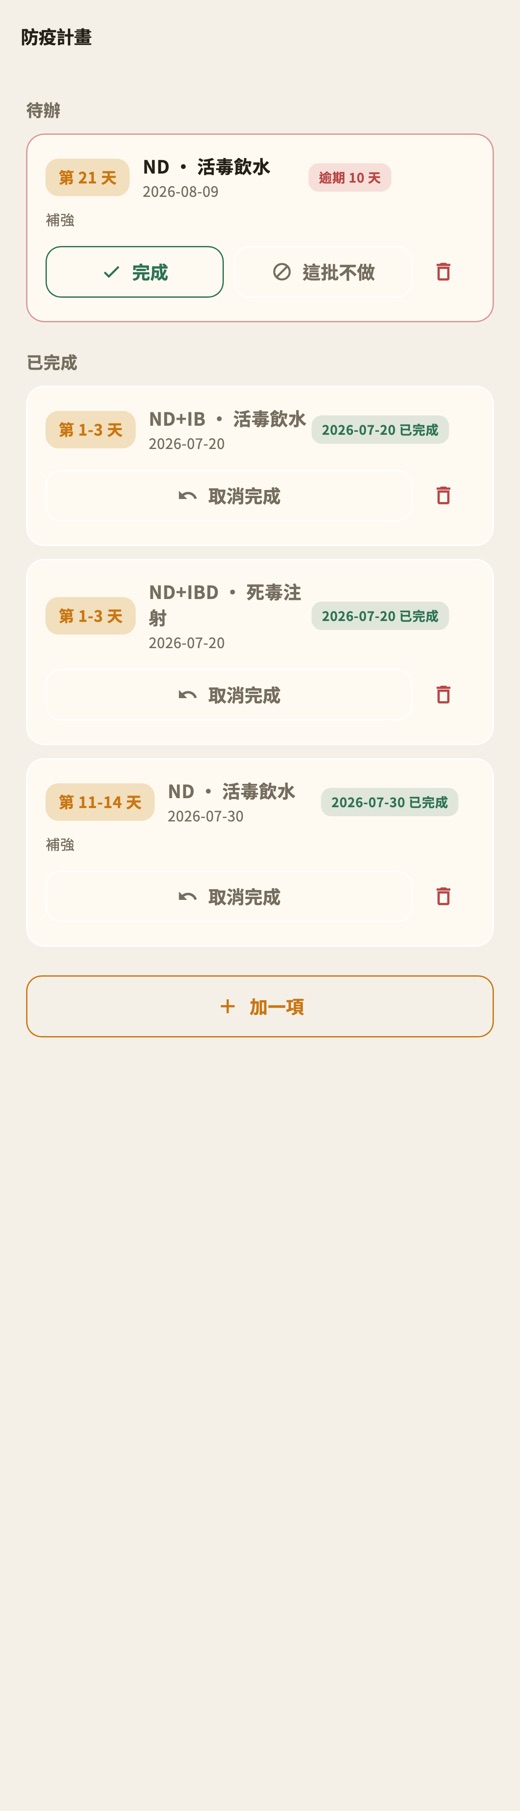
A standard Taiwanese broiler vaccination programme is built in. When you create a flock it is scheduled onto real calendar dates from the placement day (placement day counts as day 1).
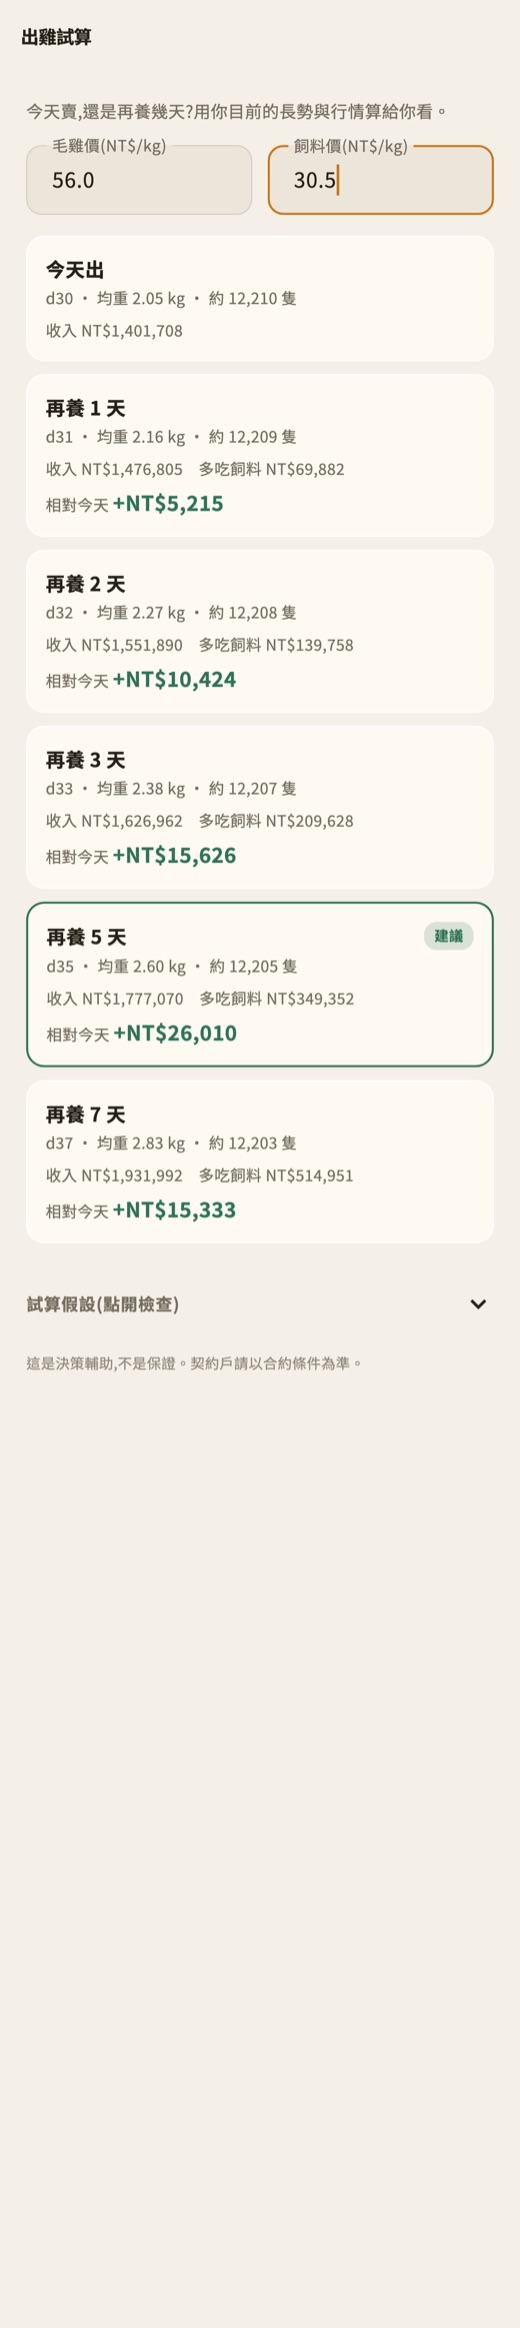
Your current deviation from standard is projected forward along the breed curve, laying every option side by side from today out to seven more days.
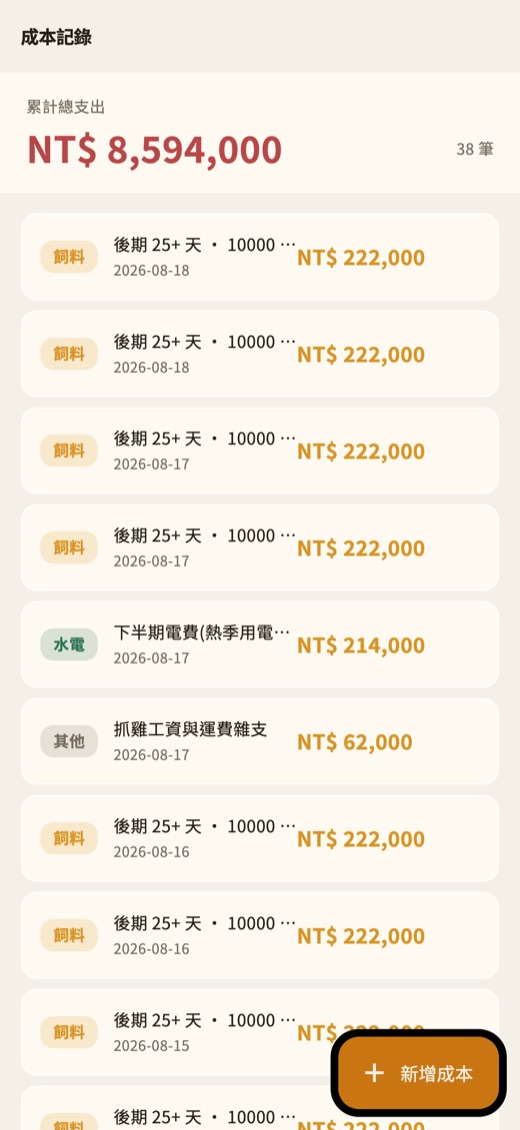
Production income, direct costs, operating expenses and other income are listed in tiers, and every tier opens up to the detail behind it.

Every item here is finished and shipping — none of it is on a roadmap.
| Feature | What it does |
|---|---|
| Multiple houses | Split one flock across several houses: losses, weigh-ins and growth curves per house, with a whole-farm summary on the home screen |
| Auto-saving daily log | Saves the moment you stop typing; switching house, changing date or leaving the page all save first, so nothing is lost to a forgotten Save button |
| Voice entry | Hands too dirty to type? Just say "three dead, one culled" — the numbers are written only after you confirm them |
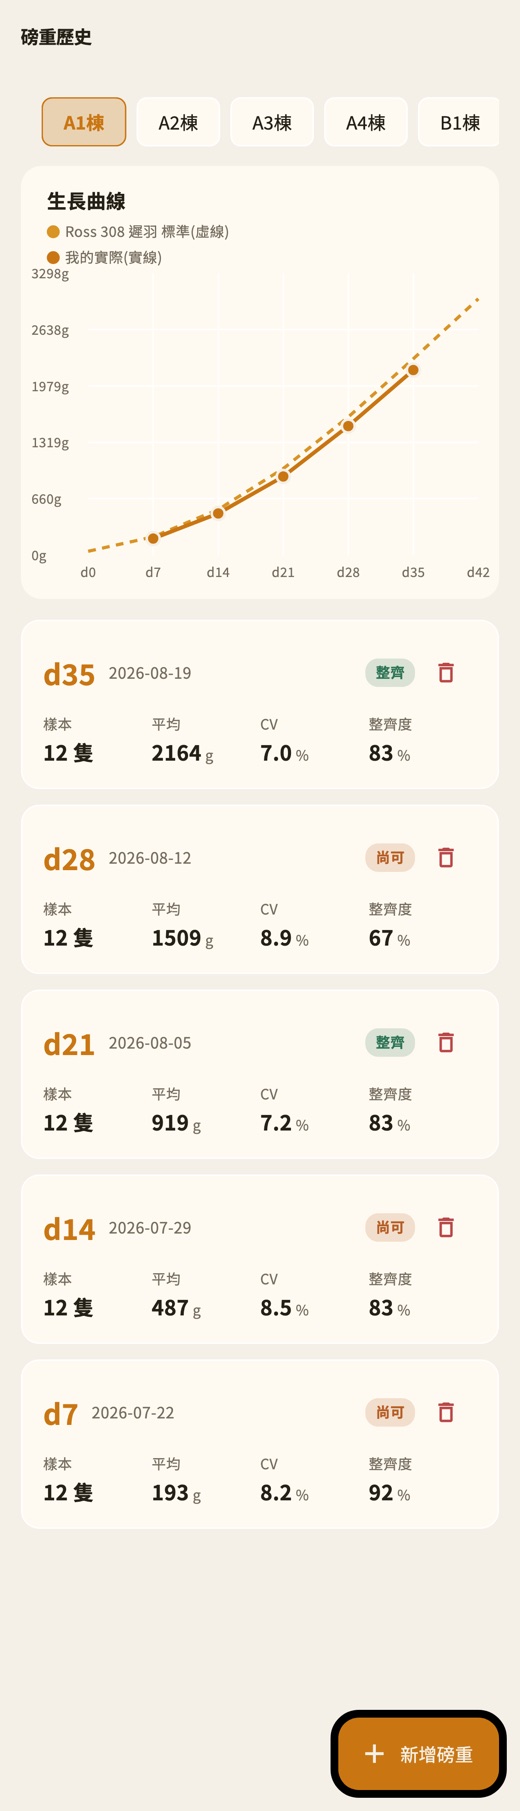
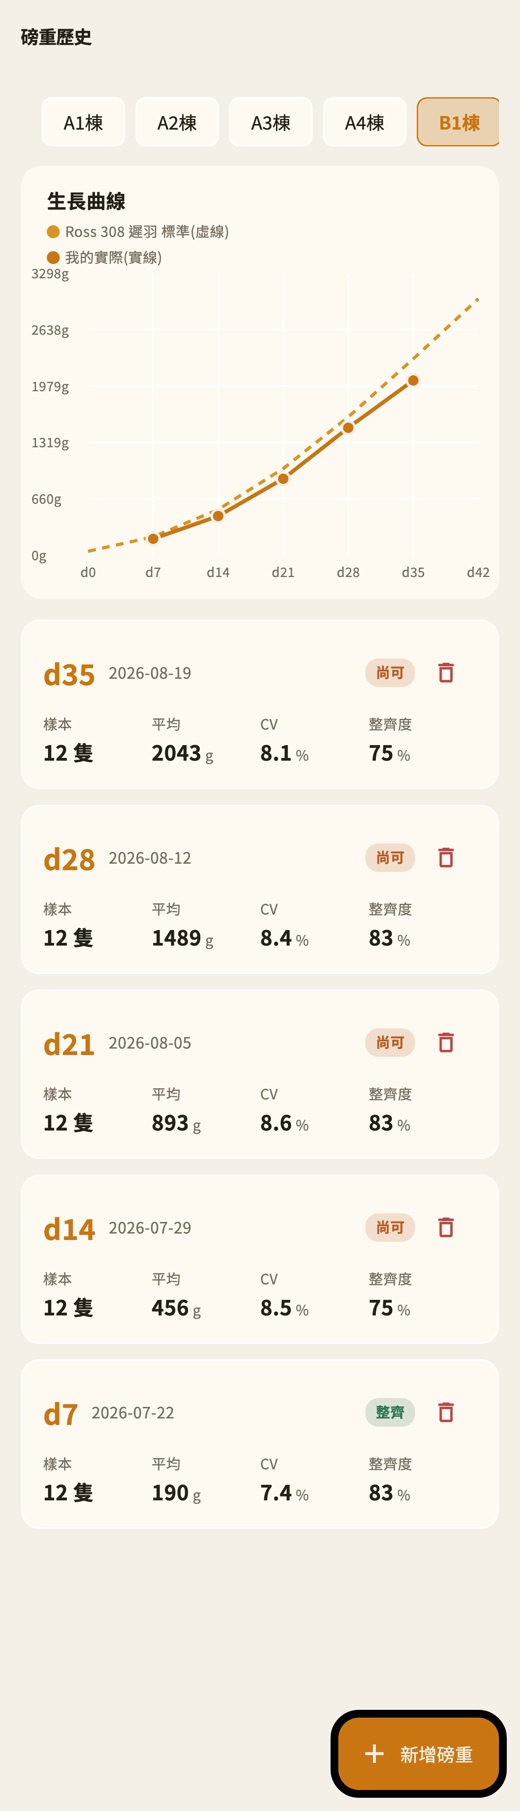
| Growth curve | Your actual weigh-ins overlaid on the breeder's official standard curve (standard dashed, your figures solid) |
| Uniformity / CV | Mean weight, CV and a uniformity grade calculated as you weigh |
| Feed deliveries | Enter the kilos off the delivery note now and the money later; estimated FCR updates in one pass |
| Problem diagnosis | Six classes of problem detected automatically, 22 rules with likely causes and a field checklist; each one can be muted or pinned |
| Margin calculator | Spot market or guaranteed-price contract, with the guaranteed price tracking feed price 1:1; eight industry association levies built in; sensitivity table |
| PDF settlement report | Production, costs, income, net profit, per-bird figures and the growth curve in one document; sensitive fields are listed before you share it |
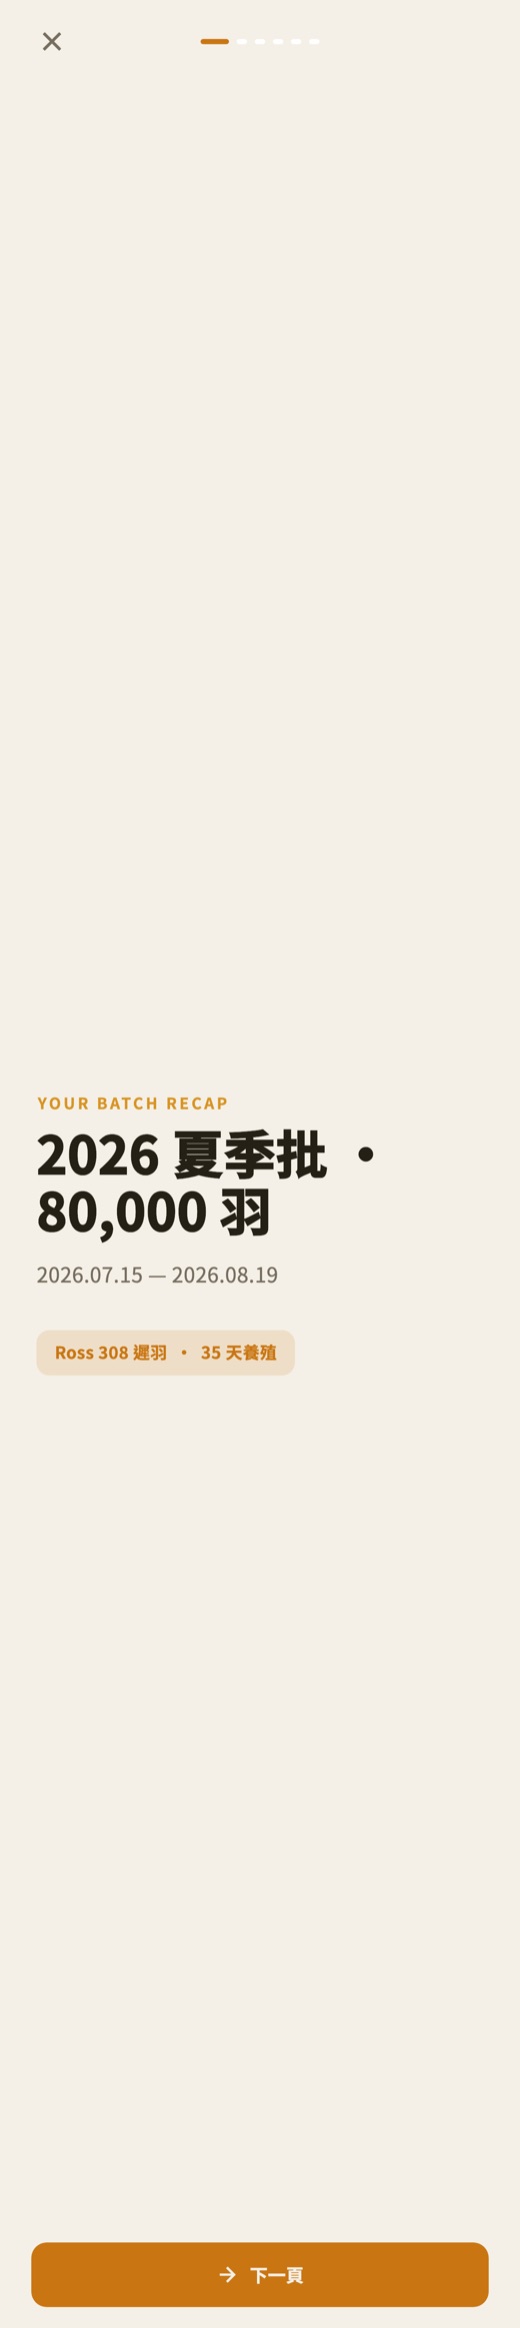
| Flock recap | A closing summary of how the flock performed once it is finished |
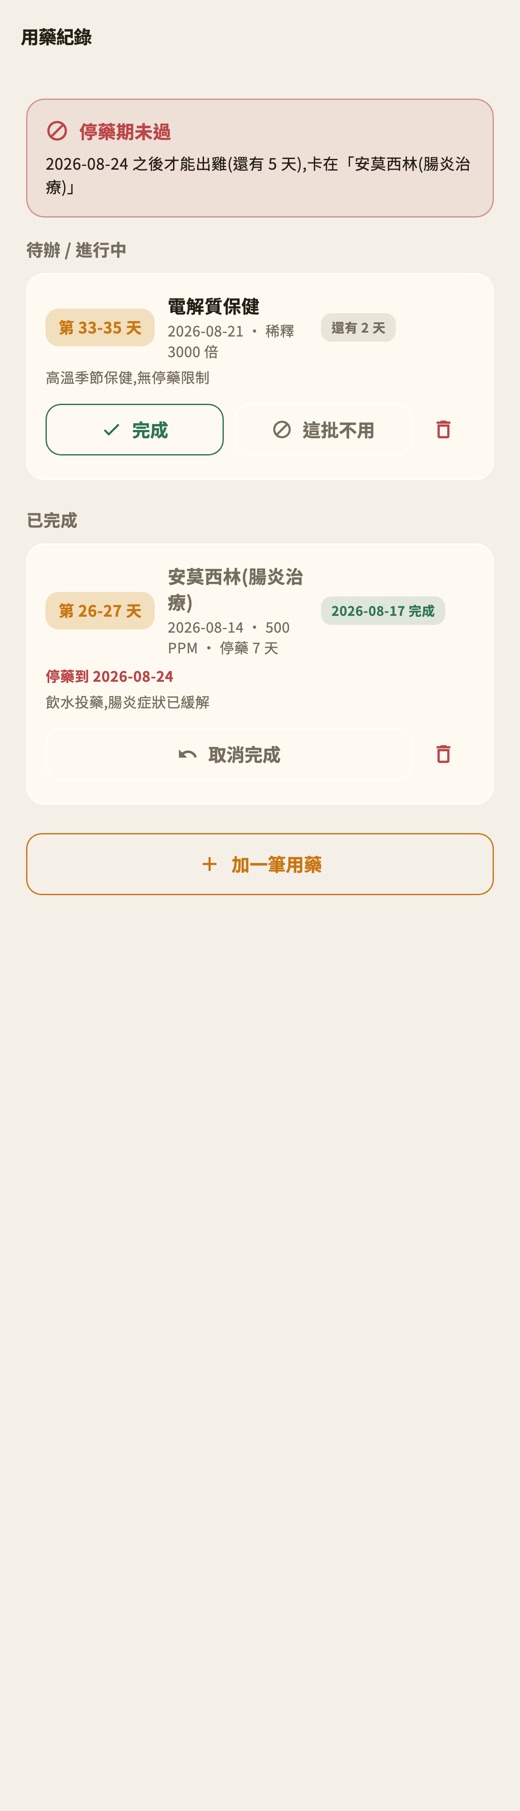
| Smart reminders | Saturday weigh-in, the day before catching, a recording streak about to break, the evening before a vaccination or treatment — all scheduled on the device |
| Backup and restore | Export a JSON file you keep yourself; restore it on a new phone in one tap |
| Bilingual interface | Switch between Traditional Chinese and English whenever you like |
Body weight, mortality, feed intake and FCR are all compared against the official performance objectives for AA+, Ross 308 slow-feathering and Cobb 500. The source documents and page numbers are recorded in the files — these are not figures we invented.
The environment assessment and the problem diagnosis are rule-based and call no external AI. Every threshold is written into the specification documents and nothing extra is hidden in the code — you and your vet can check each rule and argue with it.
No server, no account, no login. Your records live on your phone: we cannot see them and we cannot sell them. No advertising, no location, no advertising identifier.
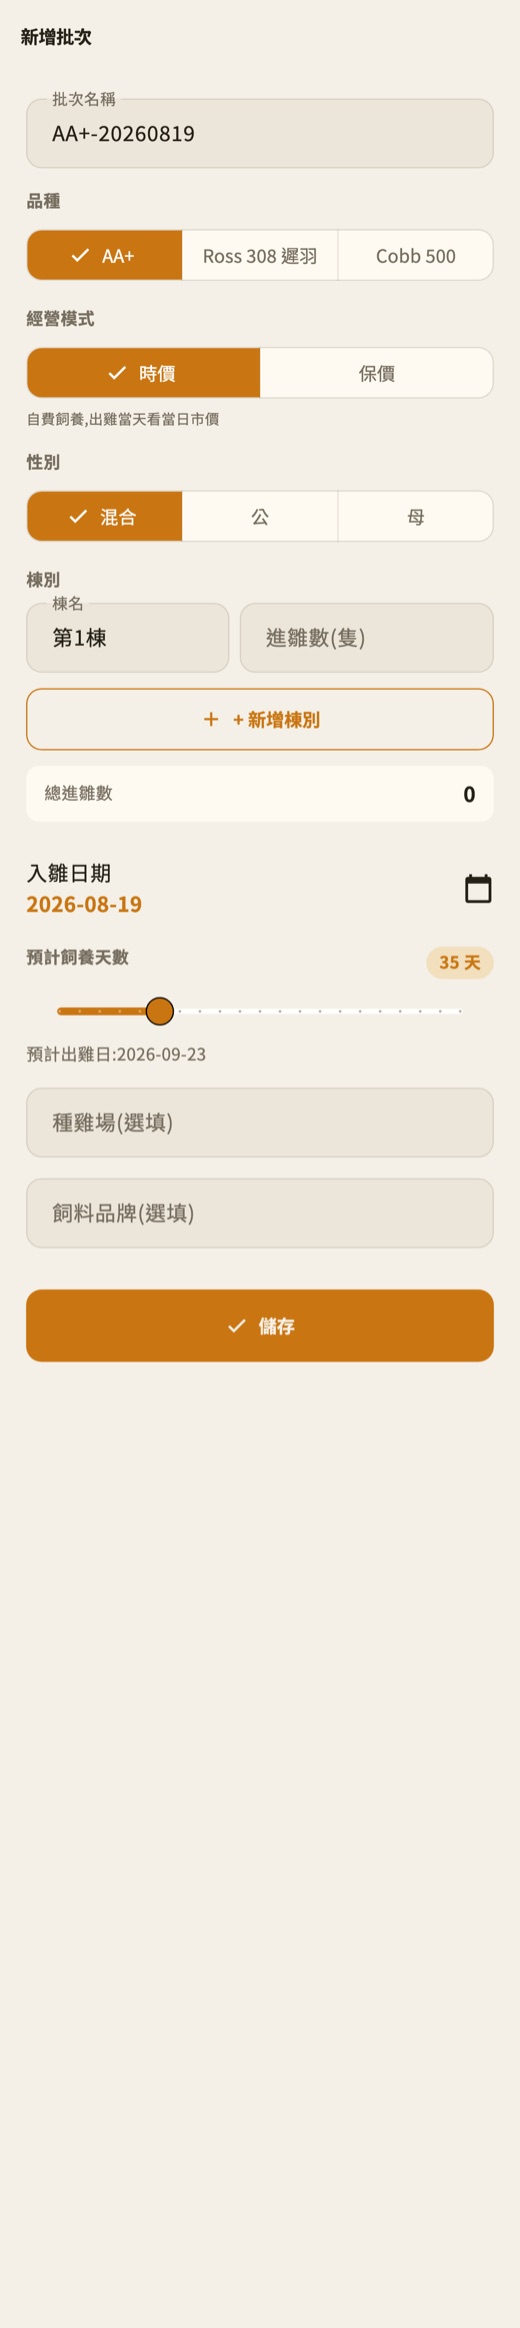
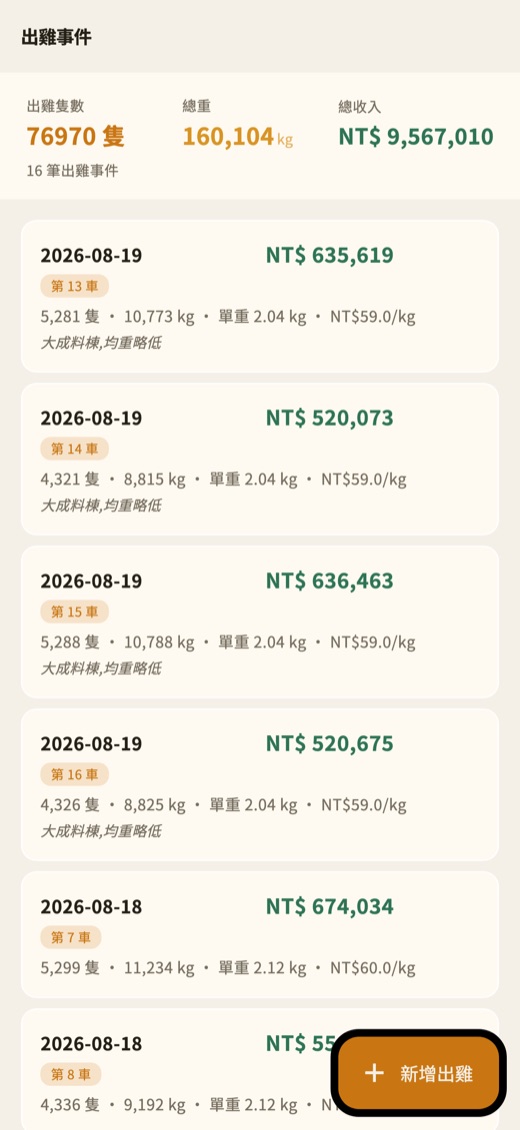
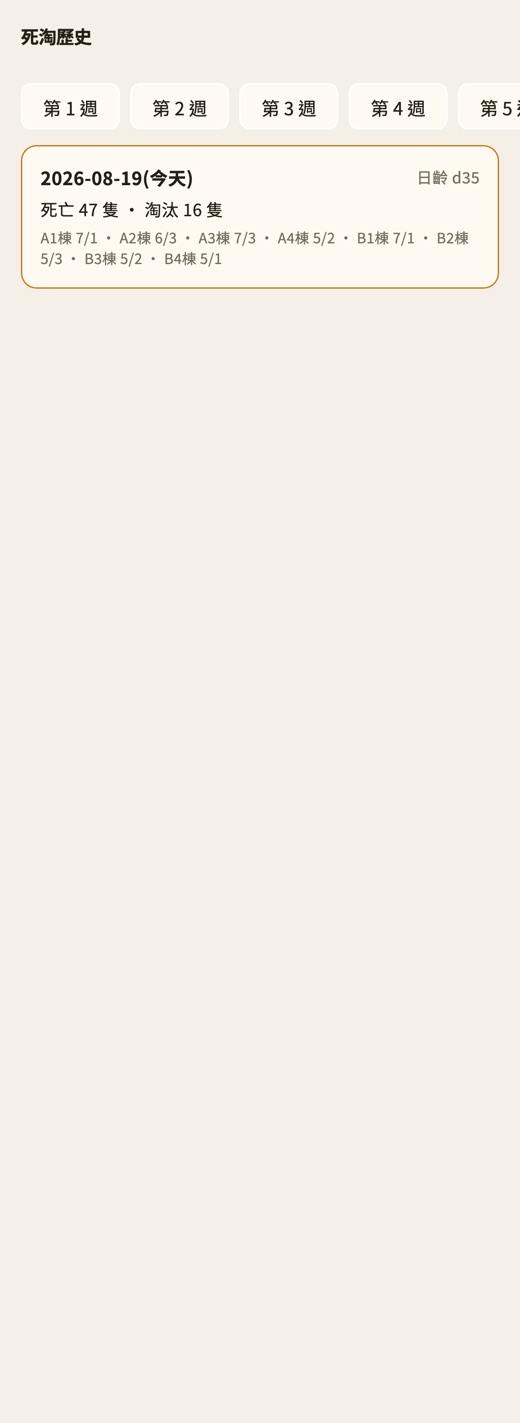
The screens below use demo data at a realistic scale: 80,000 birds across 8 houses, taken through a full 35-day cycle.


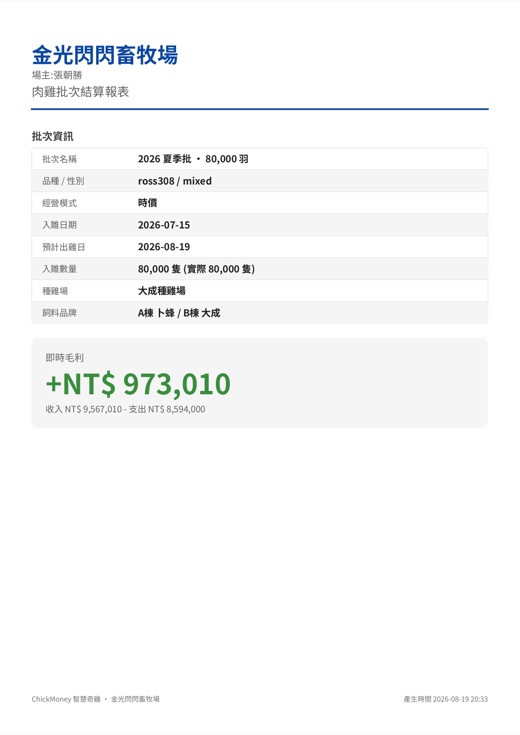
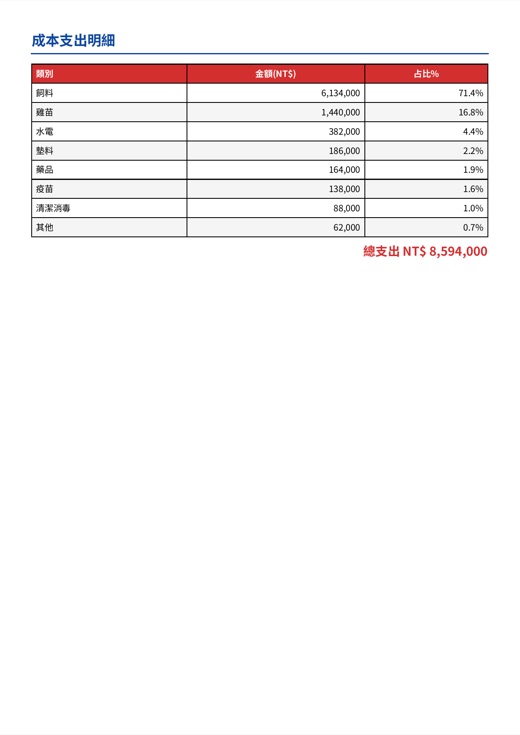
A six-page PDF — flock details, production performance, cost breakdown, income, net profit with the per-bird figures, and the growth curve — headed with your own farm name.
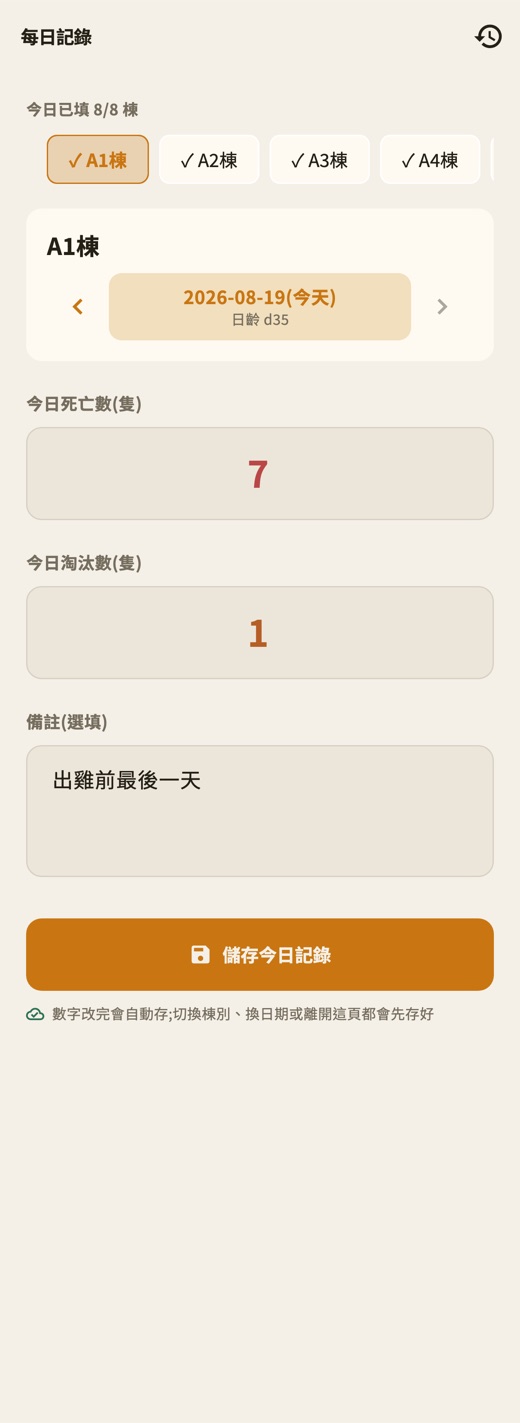
Large type, large buttons, high contrast — houses are dim and you will be wearing gloves.

One phone for the owner, one for each farmhand. They record the house; only the owner sees the money.
A farmhand's phone holds losses, weigh-ins, environment and notes. Cost, contract and profit fields simply do not exist on that device — they are not merely hidden.
The farmhand finishes the day, taps "Report", and sends that day's sheet across. No account, no sign-in, nothing passing through a server.
Tapping the file opens the app straight into a preview: which houses are new, which figures are updates. Nothing is written to the books until you confirm.
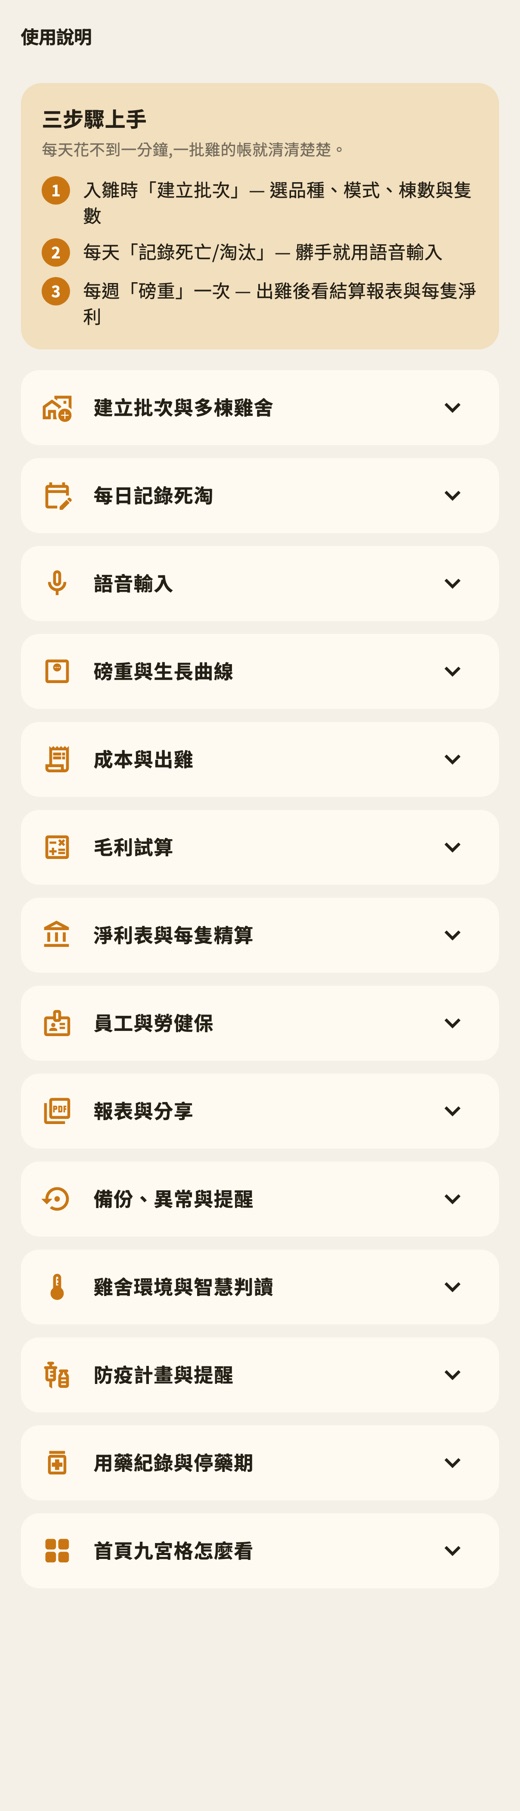
The full feature reference and walkthrough is already written up — one page, start to finish.
Read the full user guide